Students in Baltimore region are moving past the pandemic in English, but many are flubbing math

Mirroring statewide trends, Baltimore City and Baltimore County students have rebounded from the pandemic in English, but both school systems saw dramatic drops in math scores on Maryland’s annual assessment of student achievement, according to results released Tuesday afternoon.

The city and county were the only two school systems in central Maryland with pass rates lower than the state average on the Maryland Comprehensive Assessment Program, known as MCAP. However, the city school system’s scores on English rose significantly in most grades, continuing a pre-pandemic trend that began in 2018 when its increases outpaced those of other districts across the state. The county also saw large increases in certain grades in English.

On the other hand, the spring 2022 math scores were jaw-dropping. In 196 schools in the Baltimore region — including a handful in high-performing districts such as Howard and Carroll counties — less than 5{af0afab2a7197b4b77fcd3bf971aba285b2cb7aa14e17a071e3a1bf5ccadd6db} of students passed the math test in at least one grade.

In Baltimore City, some schools with large numbers of low-income families had fewer than 5{af0afab2a7197b4b77fcd3bf971aba285b2cb7aa14e17a071e3a1bf5ccadd6db} of students passing the math test in any grade. Large numbers of students did, however, pass in city schools with predominately middle-income families. Even in some of the highest-performing high schools in the region, small percentages of students passed Algebra I.

The dive in math scores has been seen across the country. Educators attribute the trend to the need to teach math concepts sequentially, and it being harder for parents to teach their children math at home during the pandemic than reading.

“Math definitely got hit hard,” said Maryland State Superintendent of Schools Mohammed Choudhury at a state school board meeting Tuesday. Although the state’s schools have a lot of work to do to improve math instruction, he said, the scores are not as bad as they first appear.

“There is the gloom story of math but there are so many kids who are close to hitting that proficiency bar,” he said, noting that about 50{af0afab2a7197b4b77fcd3bf971aba285b2cb7aa14e17a071e3a1bf5ccadd6db} of fifth graders scored just below the passing mark for math.

But educators and experts are likely to question whether the unusually big increases in English and the decreases in math stem from the COVID-19 pandemic, or whether the overhaul of the test given last spring to make it shorter than previous versions contributed. The results are supposed to be comparable.

The test has always been considered difficult, and fewer than half of students were passing across the state even before the pandemic.

Results for a new version of the MCAP were delayed because of the time it took a statewide panel of teachers to set the standard for a passing score. The last time the test was given prior to last spring was in spring 2019, before the pandemic closed schools. MCAP is given in grades 3 through 8 in math and English, as well as in 10th grade for English and algebra. The U.S. Department of Education requires testing in every public school in the country, although no two states administer the same tests.

Baltimore City’s school system, which has the highest percentage of economically disadvantaged students in the state, had the state’s lowest percentage of students passing the test in math and English. Statewide, 44{af0afab2a7197b4b77fcd3bf971aba285b2cb7aa14e17a071e3a1bf5ccadd6db} of students passed the English language arts test in grades 3 through 8, compared to 21{af0afab2a7197b4b77fcd3bf971aba285b2cb7aa14e17a071e3a1bf5ccadd6db} in the city and 38{af0afab2a7197b4b77fcd3bf971aba285b2cb7aa14e17a071e3a1bf5ccadd6db} in Baltimore County. The pass rates were 49{af0afab2a7197b4b77fcd3bf971aba285b2cb7aa14e17a071e3a1bf5ccadd6db} in Anne Arundel and Harford counties, 57{af0afab2a7197b4b77fcd3bf971aba285b2cb7aa14e17a071e3a1bf5ccadd6db} in Howard County and 60{af0afab2a7197b4b77fcd3bf971aba285b2cb7aa14e17a071e3a1bf5ccadd6db} in Carroll County.

Sign Up for Alerts

Get notified of need-to-know
info from The Banner

Baltimore City saw what would be considered significant gains in most grades in English even if students had not been through a pandemic. A 2 or 3 percentage point gain in the pass rate in any year is considered noteworthy, and there was at least a 2 percentage point increase in every grade but fifth and seventh since 2019.

The percentage of students passing the 10th grade English test in the city nearly doubled, rising to 34{af0afab2a7197b4b77fcd3bf971aba285b2cb7aa14e17a071e3a1bf5ccadd6db}.

Sonja Santelises, the CEO of Baltimore City Public Schools, saw some increases in test scores for two years in a row before the pandemic hit. She attributes some of the growth that students have made since then to a shift in focus on how to teach reading and literacy years ago that is now coming to fruition.

“I think what we see is the sprouting of the seeds that were planted before the pandemic,” Santelises said.

The school system has retrained teachers in how to teach reading, with a focus more on using phonics and building up a student’s background knowledge to be able to understand what they are reading. “The investment in early literacy is starting to pay off,” she said, adding that the system is now beginning to scale up the approach across the school system. Every first-, second- and third-grade teacher is now using the new approach, she said.

Some of the students who learned to read under the new program are now hitting middle and high school, she said.

In addition, the school system has begun focusing attention on better preparing students for a career and college, which has meant a much more intense focus on helping students who don’t read and comprehend well by the time they get to ninth grade. “We are getting ready to expand reading for the ninth graders who have gaps,” she said.

The school system must now turn to looking more closely at math instruction, she said, acknowledging just how bad the scores are. She also said some of the scores may have been affected by the differences in the tests given in 2019 and 2022.

The MCAP results also show that more schools apparently are performing well in English than in past years. Besides perennial high flyers such as Roland Park, Mount Washington, Thomas Johnson, Tunbridge and Hampstead Hill elementary/middle schools, other schools also showed solid results in some grades. Those include: Commodore John Rodgers, Tench Tilghman and Henderson-Hopkins, all in East Baltimore, as well as Lakeland, Mount Royal, Dickey Hill and Armistead Gardens.

In Baltimore County, scores rose in English in third, fourth and sixth grades, and were up significantly in 10th grade. The county’s third graders went from a 37{af0afab2a7197b4b77fcd3bf971aba285b2cb7aa14e17a071e3a1bf5ccadd6db} pass rate in 2019 to 44{af0afab2a7197b4b77fcd3bf971aba285b2cb7aa14e17a071e3a1bf5ccadd6db} in 2022 in English.

Few schools had scores at or below 5{af0afab2a7197b4b77fcd3bf971aba285b2cb7aa14e17a071e3a1bf5ccadd6db}, and some schools stood out from the rest. Eastern Technical High School and Western School of Technology had a 95{af0afab2a7197b4b77fcd3bf971aba285b2cb7aa14e17a071e3a1bf5ccadd6db} pass rate or higher in English, and Pinewood Elementary had scores in the 89th and 90th percentile for the fourth and third grades, respectively.

Baltimore County Public Schools Superintendent Darryl Williams, who announced on Monday that he isn’t seeking another term after his contract is up June 30, said in a statement to the school community on Monday that the results are “troubling,” especially in math.

“We are deeply concerned by declining performance and are working relentlessly to improve and accelerate student learning,” he said in a written statement. “We are taking immediate and strategic steps to address learning gaps and ensure Baltimore County Public Schools’ (BCPS) students not only surpass state expectations but are also equipped with the resources and knowledge they need to reach their fullest potential.”

He wrote that some of the work includes reevaluating when and how teachers deliver learning material, offering targeted tutoring support, identifying students in need of more practice and creating an English language arts and math stakeholder group for feedback for next school year.

Of county students with disabilities, 15{af0afab2a7197b4b77fcd3bf971aba285b2cb7aa14e17a071e3a1bf5ccadd6db} received a passing score in English. Among English Language Learners, third graders made up the group with the highest percentage of students who passed the English test — 21.4{af0afab2a7197b4b77fcd3bf971aba285b2cb7aa14e17a071e3a1bf5ccadd6db}. That number is lower when it comes to math: 12.6{af0afab2a7197b4b77fcd3bf971aba285b2cb7aa14e17a071e3a1bf5ccadd6db} for students with disabilities, and 16.4{af0afab2a7197b4b77fcd3bf971aba285b2cb7aa14e17a071e3a1bf5ccadd6db} for English learners.

Asian American students in the county scored the highest in both English and math compared to other racial and ethnic groups. Students who are unhoused scored 5{af0afab2a7197b4b77fcd3bf971aba285b2cb7aa14e17a071e3a1bf5ccadd6db} or less in each math category. Only third and fourth graders scored above 5{af0afab2a7197b4b77fcd3bf971aba285b2cb7aa14e17a071e3a1bf5ccadd6db} in math among foster care students.

Schools in the northwest region of Baltimore County also had low math scores. Some were below 10{af0afab2a7197b4b77fcd3bf971aba285b2cb7aa14e17a071e3a1bf5ccadd6db} in every category, while others couldn’t break above 5{af0afab2a7197b4b77fcd3bf971aba285b2cb7aa14e17a071e3a1bf5ccadd6db}. They include Northwest Academy of Health Sciences, Woodlawn Middle School, Deer Park Middle Magnet School, Windsor Mill Middle School, Milford Mill Academy, Randallstown High School, Owings Mills High School, Franklin High School and New Town High School.

Other low-performing schools in math include Towson, Loch Raven, Perry Hall , Overlea, Kenwood, Sparrows Point and Chesapeake high schools; George Washington Carver Center for Arts and Technology; and Deep Creek Magnet Middle Community School.

In Baltimore County, the differences in achievement between economically disadvantaged students and those who aren’t is stark. Beginning in third grade, the passing rate on the English test of those who aren’t economically disadvantaged is twice that of those who are. That gap only grows, and by eighth grade, only 16{af0afab2a7197b4b77fcd3bf971aba285b2cb7aa14e17a071e3a1bf5ccadd6db} of disadvantaged students are passing the English test compared to 40{af0afab2a7197b4b77fcd3bf971aba285b2cb7aa14e17a071e3a1bf5ccadd6db} of those who aren’t.

Williams said it is important to note that there have been significant gaps in the performance of county students on state tests for years, and that the needs of students are growing.

“We have a rapidly growing English Language Learner (ELL) population and have seen a substantial increase in the number of students who are eligible for Free- and Reduced-price Meals (FARMS),” he said in a statement. “We have also seen significant growth in the number of students receiving special education services.”

He said his proposed $2.6 billion budget for the next fiscal year addresses these challenges.

State department officials said they have looked at how students did over time, and there is good news in the increases seen in English as students moved from third to fifth grade over a period of years. But the same analysis also showed that students were losing ground in math even before the pandemic hit.

Baltimore Banner data fellow Shreya Vuttaluru and data reporter Ryan Little contributed to this report.

liz.bowie@thebaltimorebanner.com

kristen.griffith@thebaltimorebanner.com

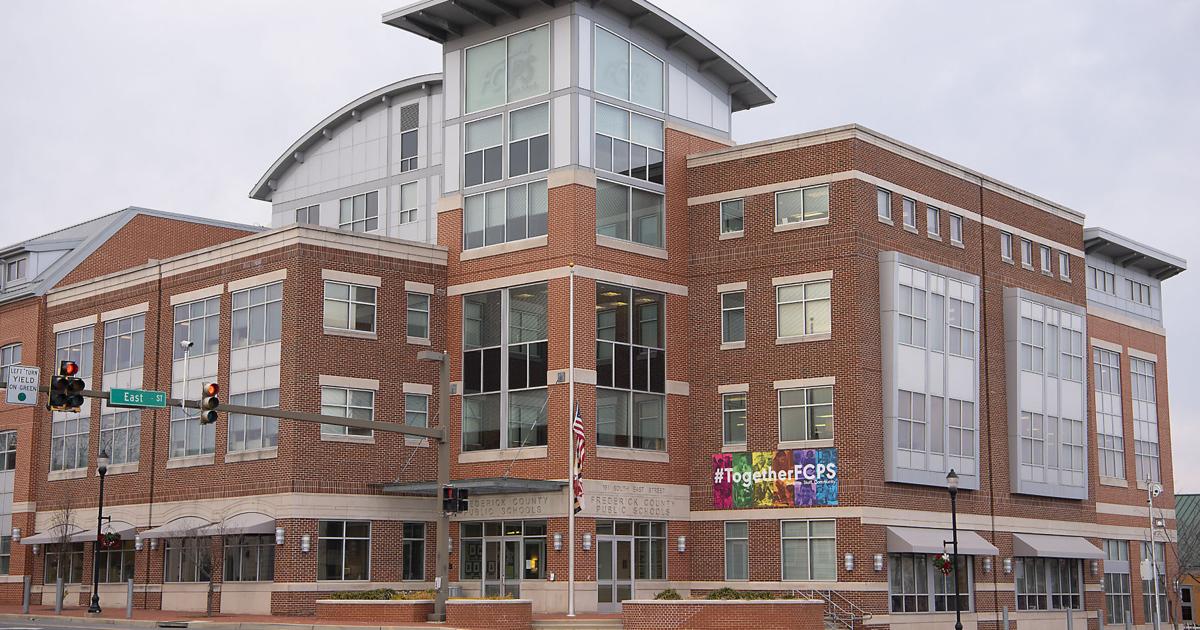
Services for English learners, special education students among FCPS’ budget priorities

Jan. 18—At a six-hour price range workshop on Wednesday, members of the Frederick County Board of Schooling read from leaders throughout the school system about what their departments want most.

Companies for distinctive schooling learners, English learners and other minority groups had been among the subject areas board members discussed at length in the course of the session, which showcased a line-by-line assessment of the district’s paying out plan for fiscal 12 months 2024.

FCPS Superintendent Cheryl Dyson has proposed a $933 million price range for Frederick County Public Educational facilities. If approved devoid of adjustments, it would symbolize a 13.4{af0afab2a7197b4b77fcd3bf971aba285b2cb7aa14e17a071e3a1bf5ccadd6db} raise in the district’s spending budget over fiscal 12 months 2023.

On Wednesday, leaders from just about every FCPS division introduced to the board, conveying their priorities and building the circumstance for their requested funding will increase.

Keith Harris, director of FCPS’ Accelerating Accomplishment and Equity department, spoke about the have to have to bolster products and services to English learners.

The variety of pupils who want English-mastering companies in FCPS has improved substantially in current a long time, Harris claimed. So far this faculty year, the district has extra 348 students who have been designated as English learners (EL). Sixty-two of them joined in January alone.

By the stop of this school calendar year, Harris said, the district expects to have “perfectly more than” 4,000 EL pupils.

Harris’ section is requesting funding for 11 new academics who will assistance continue on the district’s attempts to decentralize its EL expert services. Considering that EL courses are only offered at sure educational facilities in the county, the district often have to transportation students out of their residence location to serve them.

About 150 middle and high college students have refused EL companies from the county simply because they never want to attend a distinctive university, Harris said Wednesday.

His department’s finances request also incorporates funding for an more therapist to provide EL learners. At this time, there is only a single particular person in that function.

Harris is also requesting funding for an “fairness coordinator” in his department, who would aid implement new expert discovering prerequisites connected with points like the district’s just lately passed Anti-Racism Coverage.

FCPS Deputy Superintendent Mike Markoe and Special Schooling Director Linda Chambers spoke about the district’s ongoing energy to improve providers for students with disabilities, which have been underneath elevated scrutiny due to the fact December 2021, when a U.S. Section of Justice report exposed that FCPS experienced been systematically misusing seclusion and restraint.

The most important requested enhance in this year’s exclusive schooling spending budget is a $3.5 million fund that officials hope to established apart and eventually use to put into action the tips of an forthcoming impartial audit.

The audit, which will analyze the totality of FCPS’ procedure for educating pupils with disabilities, isn’t anticipated to create remaining benefits until eventually this spring.

Right until then, Dyson claimed Wednesday, FCPS ideas to aim on “reduced-hanging fruit” — improvements that are easier to carry out, like choosing additional behavioral help experts and shifting to a extra contemporary procedure for running Individual Education Options.

“We never want to begin carrying out a bunch of things, and then have the audit occur again and say you really should actually be undertaking some thing else,” she told board users.

College student Solutions Director Dana Falls spoke about his department’s hopes to employ far more school psychologists and therapists.

Psychological health and fitness has been a local community precedence, reported board Vice President Dean Rose.

Board associates will shell out the following 6 months reviewing and balancing the budget, which at present has a $79.5 million deficit.

Services for English learners, special education students among FCPS’ budget priorities | Funding

At a six-hour price range workshop on Wednesday, customers of the Frederick County Board of Schooling listened to from leaders throughout the college system about what their departments have to have most.

Expert services for special education and learning pupils, English learners and other minority groups were being among the topics board users talked over at duration during the session, which showcased a line-by-line evaluation of the district’s paying approach for fiscal yr 2024.

MO report shows more students finish, pass online courses

MO report shows more students finish, pass online courses

A extraordinary spike in Missouri general public faculty learners having virtual courses licensed by the state all through the pandemic appears to be leveling off.

Past yr, 14 companies approved by the Missouri Study course Entry and Digital Faculty Program — identified as MOCAP — served 3,831 students throughout the 2021-22 12 months.

The general amount of learners dropped final calendar year but those enrolled took much more programs, on common. Need was specially large in grades 9-12.

Very last 7 days, for the third 12 months, MOCAP documented its enrollment and tutorial accomplishment info to the Missouri Board of Training. The K-12 and Advanced Placement programs licensed by MOCAP are aligned to condition mastering benchmarks and are only taught by absolutely accredited Missouri lecturers.

The report presents a snapshot of on the net learning in Missouri and how pupils in MOCAP courses score on point out-mandated exams in contrast to individuals discovering in man or woman.

Should students have to change clothes for PE class?

The itchy T-shirt and drab mesh shorts. The loss of self-identity. The awkwardness of switching in entrance of classmates.

These are some of the motives pupils give for disliking obligatory uniforms for health club class.

But for teachers and university directors, the pros and drawbacks of actual physical instruction dress codes are a little bit more elaborate. And what was the moment a conventional ritual of center and large colleges is finding far more comfortable in some areas.

Colleges in New Jersey, Texas and Virginia have manufactured switching apparel for PE class optional in current many years. 

In the course of the pandemic, and even in the yrs prior to, some educational institutions eased demands for necessary PE uniforms or shifting into PE attire. The concern in the course of the pandemic was getting students congregate in restricted locker area areas.

But other concerns continued to crop up, as properly. Student stress about modifying in front of peers, the time it took to transform outfits, and no matter if procedures were equitable for selected scholar populations led to some colleges easing their dress codes.

However, supporters of obligatory PE gown codes cite added benefits to standardizing how college students dress for fitness center course, these as security, cleanliness, encouraging active participation, and engendering a feeling of faculty pride.

Quite a few colleges continue to demand pupils to order and put on a precise PE uniform. For case in point, the website of Westwood Middle University in Spokane, Washington, mentioned study shows “learners who have on uniforms in a physical fitness class truly feel unified, approved, happier and operate more challenging.”

“The purpose of dressing in actual physical schooling has to do with [how] to facilitate motion,” claimed Cara Grant, a director on the board at Condition The us, which represents health and bodily schooling professionals. “Reduced restriction dependent on garments, this just does not get the job done properly when you are hoping to move your system.” 

Very best procedures

Form America does not have an formal place on required PE dress codes, stated Grant, adding that those people choices are generally produced at the faculty degree. Grant is also pre-K-12 supervisor of well being and physical schooling for Montgomery County General public Faculties in Maryland. 

The corporation also would not observe PE course costume insurance policies. It does, even so, have tutorial observe recommendations that say it’s inappropriate to foundation university student grades on compliance with dressing specifications. Some states like California also have procedures restricting circumstances in which dressing for PE class can count towards a student’s PE grade.

By not tying grades to compliance with a gown code, the Form The us guidelines brought national visibility to the intention of gown procedures, which is “to get kids shifting and have them shift in a safe and sound way,” Grant stated.

She said since the pandemic, much more faculties are encouraging learners to come to university in completely ready-to-go attire, this kind of as athletic shoes and shirts and pants that help motion. But some faculties experienced already started to make transforming for PE class optional for other good reasons. 

Learners in center and superior faculties are likely as a result of puberty and can experience unpleasant altering in a team location. LGBTQ pupils, in specific, can truly feel unpleasant shifting in locker rooms. Some learners with specified religious beliefs stated the PE costume codes weren’t modest plenty of.

For pupils who are homeless or who stay with divorced mothers and fathers, bringing PE-authorised garments to university can be burdensome. 

Condition The united states endorses colleges give private modifying, showering and restrooms for transgender pupils but that transgender students not be needed to use different amenities.

If a university or district is contemplating altering its PE dress plan, Grant advises educators to emphasis on what they want college students to know and be equipped to do pertaining to the PE class curriculum and how the college can assistance that.

Physician Assistant Students’ Perception of Online Didactic Education: A Cross-Sectional Study

Purpose: This study describes physician assistant students’ perception toward online didactic education and highlights relationships between student characteristics and their preference for online learning.

Methods: A previously validated survey questionnaire was administered online to physician assistant students enrolled in traditional, in-person training programs across the United States. The survey consisted of five Likert-scale statements measuring perceptions of online learning and was rated on a seven-point Likert scale. Students also reported their age, gender, history of taking an online course, and preferred learning style. Mean scores were reported for agreement with each Likert-scale statement; Pearson correlation coefficients, one-way ANOVA with post hoc Tukey tests, and independent samples t-tests were used to determine relationships between student characteristics and their preference for online learning.

Results: A total of 391 completed surveys met the inclusion criteria for the study and were used in data analysis. The average age of respondents was 25.98 years, 81.1{af0afab2a7197b4b77fcd3bf971aba285b2cb7aa14e17a071e3a1bf5ccadd6db} (n = 317) were female, 96.2{af0afab2a7197b4b77fcd3bf971aba285b2cb7aa14e17a071e3a1bf5ccadd6db}, (n = 376) reported taking an online course previously, and preferred learning styles were reported as 36.1{af0afab2a7197b4b77fcd3bf971aba285b2cb7aa14e17a071e3a1bf5ccadd6db} (n = 141) visual, 7.7{af0afab2a7197b4b77fcd3bf971aba285b2cb7aa14e17a071e3a1bf5ccadd6db} (n = 30) auditory, 15.6{af0afab2a7197b4b77fcd3bf971aba285b2cb7aa14e17a071e3a1bf5ccadd6db} (n = 61) reading/writing, and 40.7{af0afab2a7197b4b77fcd3bf971aba285b2cb7aa14e17a071e3a1bf5ccadd6db} (n = 159) kinesthetic. Nearly a quarter of respondents indicated they preferred online courses, particularly students with a preferred learning style of reading/writing. No relationships were observed between age, gender, or history of taking an online course and preference for online education.

Conclusion: Most physician assistant students prefer in-person learning. However, a substantial number prefer online learning, and a significant number of these students reported a preferred learning style of reading/writing. More research is necessary to give educational institutions the ability to make data-driven, student-centered program development decisions. However, data in this study indicate a need for continued development of online/hybrid physician assistant programs to better align with current student preferences. 

Introduction

Since the inception of the profession in 1965, physician assistants (PAs) have learned to practice medicine through a combination of in-person didactic instruction followed by the completion of supervised clinical practice experiences at affiliated hospitals and clinics. Although this is an effective curriculum delivery method, pioneers in the field have also recently demonstrated the feasibility of hybrid PA education [1]. In the hybrid model, students complete the didactic year predominantly online, followed by traditional, in-person clinical training. Anderson summarized some of the benefits of online medical education [2]. These include fostering the development of self-directed learners [3], enhancing student engagement in the classroom [4], expanding opportunities for interprofessional education experiences [5,6], promoting digital literacy with medical technology [7], widening the instructor pool [7,8], removing barriers to attending PA school [9], repurposing time spent commuting [4], allowing students to live in and learn about the communities where they may one day practice, and helping to close the gap of clinician shortages in underserved areas [10]. The ability to teach didactic content online may also prove beneficial considering recent changes to the educational landscape following the severe acute respiratory syndrome coronavirus 2 (SARS‑CoV‑2)/coronavirus disease 2019 (COVID-19) pandemic. During this time, remote learning in the didactic year across PA programs increased from 6.4{af0afab2a7197b4b77fcd3bf971aba285b2cb7aa14e17a071e3a1bf5ccadd6db} before the pandemic to 96.8{af0afab2a7197b4b77fcd3bf971aba285b2cb7aa14e17a071e3a1bf5ccadd6db} during the pandemic [11]. During this time, there has also been increasing program director support for online didactic education in PA programs [12]. Now that online didactic PA education is possible, innovative PA educators should seek to determine what method of curriculum delivery students prefer, and analyze these preferences to help guide future program development decisions.

A review of the current literature indicates an overall preference for traditional in-person education over online learning among health professions students, both within and outside of the PA profession; however, research specific to the PA community is limited. In a 2006 seminal study, Day et al. concluded that PA students preferred in-person over online curriculum delivery [13], and in 2009, York et al. observed that 78{af0afab2a7197b4b77fcd3bf971aba285b2cb7aa14e17a071e3a1bf5ccadd6db} of PA students enrolled in a web-based evidence-based medicine course stated they would have preferred in-person lectures instead of, or in addition to, online learning [14]. A review of the literature outside of the PA profession yields similar findings [15-17]. Although video-recorded lectures were found to be of equal or more educational value when compared to in-person instruction, Harvard Medical School students continued to attend traditional lectures if given the choice [15]. Hamilton et al. reported that third-year pharmacy students favored a blended educational approach as opposed to an exclusively online course [16]. A study by Bramer et al. also found that United Kingdom nursing students preferred a balanced mixture of online and face-to-face learning and did not feel that online learning should replace traditional teaching [17].

Further research is needed to explore the current preferences of didactic PA students regarding in-person versus online education to ensure PA program development decisions are student-centered, evidence-based, and data-driven. This is especially important considering the number of new PA programs in development and the number of existing programs that are adapting their curricula to combat current and evolving barriers to medical education. The current study sought to narrow this information gap by determining the curriculum delivery preferences of currently enrolled didactic PA students. Participants were also asked to report their age, gender, history of taking an online course, and preferred learning styles to determine if an association existed between any of these factors and their preference for online education.

Materials & Methods

Study description 

This was a cross-sectional survey study. Risks were minimal and consisted of time lost by students to complete the survey and the potential loss of confidentiality among participants. To mitigate these risks, the survey was designed to be completed in fewer than five minutes, participation was a one-time endeavor with no follow-up, and no personally identifiable information was collected. The primary benefit of the study was insight into the preferences of didactic PA students regarding their preferred curriculum delivery method. This could help current and future programs plan the instructional design of their curriculum. The study proposal was reviewed and approved by the institutional review board (IRB) of A.T. Still University, Mesa, Arizona, United States (approval number: 2021-174), and secondary approval was given by Franklin Pierce University, Rindge, New Hampshire, United States (protocol number: 08252021) for exempt status prior to data collection. 

Study sample

The Physician Assistant Education Association (PAEA) Program Report 35 reported that the maximum capacity enrollment of didactic students in PA programs across the United States was 11,299 [18]. According to a sample size estimator by Qualtrics (Seattle, Washington, and Provo, Utah, United States), 372 individuals from this population needed to be sampled to adequately represent the target population [19]. Inclusion criteria for participation were as follows: students had to be at least 18 years old, be enrolled in a currently accredited PA Program in the United States, and be in their didactic phase of study. Students at the Yale PA online program were excluded from participation as the principal investigator felt they may reasonably have a favorable bias toward online education. The principal investigator currently works for Franklin Pierce University and has previously been employed by the University of South Alabama; therefore, students from these institutions were also excluded to limit participation bias. 

Survey design and distribution

A previously validated survey instrument from O’Malley et al. [20] regarding perceptions of online education was adapted for use in the study, with the author’s permission. The adapted survey consisted of two questions to identify eligibility criteria, five Likert-scale questions regarding student perception of online education, and four student characteristic/demographic questions: (i) age, (ii) gender, (iii) history of taking an online course previously, and (iv) preferred VARK (visual, auditory, reading/writing, kinesthetic) learning style [21]. An alphabetical list of currently accredited PA programs by state from the Accreditation Review Commission on Education for the Physician Assistant (ARC-PA) website was used to determine which programs to target for student recruitment [22]. The program director for the first accredited program listed for each state was sent a recruitment email asking whether they would offer participation to their didactic students. Those who agreed were asked to forward a standardized student-specific recruitment email to their currently enrolled didactic students that described the study’s purpose, risks, and benefits, and informed students that participation was voluntary, and completion of the survey was considered their consent to participate. The email also provided a link to the survey should they wish to complete it. If no response was received from a program director after one week, the recruitment email was sent for a second and final time. At the end of every two-week period, the next accredited program listed on the ARC-PA website for each state was contacted. This process continued, every two weeks, until the needed sample size of 372 qualified surveys was completed. 

Data collection, storage, and analysis

Data were collected from September through December 2021. Both ordinal and nominal (categorical) data were collected and stored on the SurveyMonkey platform (Momentive Inc., Waterford, New York). Following data collection, descriptive (frequencies, percentages, means, standard deviations, and confidence intervals) and comparative statistics were conducted using IBM SPSS Statistics for Windows, Version 28.0 (Released 2021, Armonk, New York). To determine if a correlation existed between age and preference for online education, a Pearson correlation coefficient was calculated for each Likert-scale statement; p-values less than .05 were used to determine statistical significance. A one-way ANOVA test was used to compare means among Likert-scale statements according to the four different preferred learning styles of participants; p-values less than .05 were used to determine statistical significance. Post hoc Tukey tests were then conducted to determine pairwise differences between the preferred learning styles for each Likert-scale statement; p-values less than .05 were used to determine statistical significance. Independent samples t-tests were used to determine if there was a significant difference in mean Likert-scale scores between genders or between those who had taken an online course previously versus those who had not; because multiple t-tests were conducted, the criterion for statistical significance was adjusted downward to a p-value less than 0.1 to control for alpha inflation in accordance with the Bonferroni correction.

Results

PA program participation and student characteristics 

The researchers did not directly access the study sample (didactic PA students), which instead had to be recruited to the study by PA program directors of invited programs. Therefore, the total number of student participants who received the survey was unknown and an accurate response rate could not be calculated. Approximately 35{af0afab2a7197b4b77fcd3bf971aba285b2cb7aa14e17a071e3a1bf5ccadd6db} (50/141) of PA programs invited to the study responded to the email request, and 32{af0afab2a7197b4b77fcd3bf971aba285b2cb7aa14e17a071e3a1bf5ccadd6db} (45/141) opted to participate. These programs represented didactic PA students across 31 states. At the conclusion of data collection, 472 surveys were received, of which 391 were complete, met inclusion criteria for the study, and were subsequently used for data analysis. The average age of the study sample was 25.98 years (range = 21-51 years). Gender was reported as 18.4{af0afab2a7197b4b77fcd3bf971aba285b2cb7aa14e17a071e3a1bf5ccadd6db} (n = 72) male, 81.1{af0afab2a7197b4b77fcd3bf971aba285b2cb7aa14e17a071e3a1bf5ccadd6db} (n = 317) female, 0.3{af0afab2a7197b4b77fcd3bf971aba285b2cb7aa14e17a071e3a1bf5ccadd6db} (n = 1) gender non-binary, and 0.3{af0afab2a7197b4b77fcd3bf971aba285b2cb7aa14e17a071e3a1bf5ccadd6db} (n = 1) preferred not to answer. Most participants (96.2{af0afab2a7197b4b77fcd3bf971aba285b2cb7aa14e17a071e3a1bf5ccadd6db}, n = 376) reported taking an online course previously. The distribution of preferred learning styles of the sample was 36.1{af0afab2a7197b4b77fcd3bf971aba285b2cb7aa14e17a071e3a1bf5ccadd6db} (n = 141) visual, 7.7{af0afab2a7197b4b77fcd3bf971aba285b2cb7aa14e17a071e3a1bf5ccadd6db} (n = 30) auditory, 15.6{af0afab2a7197b4b77fcd3bf971aba285b2cb7aa14e17a071e3a1bf5ccadd6db} (n = 61) reading/writing, and 40.7{af0afab2a7197b4b77fcd3bf971aba285b2cb7aa14e17a071e3a1bf5ccadd6db} (n = 159) kinesthetic (hands-on). 

Participant preferences for online education

Table 1 reports the study participants’ agreement and disagreement with statements pertaining to their perception of online education. Most students disagreed to some degree (strongly disagreed, disagreed, or somewhat disagreed) with four out of the five Likert-scale statements studied; 76.5{af0afab2a7197b4b77fcd3bf971aba285b2cb7aa14e17a071e3a1bf5ccadd6db} (n = 299) disagreed with the statement “Most people believe that online learning is more effective than traditional methodologies”, 72.4{af0afab2a7197b4b77fcd3bf971aba285b2cb7aa14e17a071e3a1bf5ccadd6db} (n = 283) disagreed with the statement “In a course with both traditional and online methodologies, I learn better through the online portion”, 69.4{af0afab2a7197b4b77fcd3bf971aba285b2cb7aa14e17a071e3a1bf5ccadd6db} (n = 271) disagreed with the statement “I prefer online courses to traditional courses”, and 59{af0afab2a7197b4b77fcd3bf971aba285b2cb7aa14e17a071e3a1bf5ccadd6db} (n = 231) disagreed with the statement “I believe that I can learn the same amount in an online course as in a traditional course.” In contrast, most students (56.5{af0afab2a7197b4b77fcd3bf971aba285b2cb7aa14e17a071e3a1bf5ccadd6db}, n = 221) agreed to some degree (strongly agreed, agreed, or somewhat agreed) with the statement “I believe that I can make the same grade in an online course as in a traditional course.”

Likert-scale Statement Strongly Disagree, n ({af0afab2a7197b4b77fcd3bf971aba285b2cb7aa14e17a071e3a1bf5ccadd6db}) Disagree, n ({af0afab2a7197b4b77fcd3bf971aba285b2cb7aa14e17a071e3a1bf5ccadd6db}) Somewhat Disagree, n ({af0afab2a7197b4b77fcd3bf971aba285b2cb7aa14e17a071e3a1bf5ccadd6db}) Neither Agree nor Disagree, n ({af0afab2a7197b4b77fcd3bf971aba285b2cb7aa14e17a071e3a1bf5ccadd6db}) Somewhat Agree, n ({af0afab2a7197b4b77fcd3bf971aba285b2cb7aa14e17a071e3a1bf5ccadd6db}) Agree, n ({af0afab2a7197b4b77fcd3bf971aba285b2cb7aa14e17a071e3a1bf5ccadd6db}) Strongly Agree, n ({af0afab2a7197b4b77fcd3bf971aba285b2cb7aa14e17a071e3a1bf5ccadd6db})
Most people believe that online learning is more effective than traditional methodologies. 96 (24.6) 125 (32.0) 78 (19.9) 29 (7.4) 39 (10.0) 14 (3.6) 10 (2.6)
In a course with both traditional and online methodologies, I learn better through the online portion. 104 (26.6) 117 (29.9) 62 (15.9) 35 (9.0) 29 (7.4) 27 (6.9) 17 (4.3)
I prefer online courses to traditional courses. 116 (29.7) 96 (24.6) 59 (15.1) 27 (6.9) 41 (10.5) 25 (6.4) 27 (6.9)
I believe that I can learn the same amount in an online course as in a traditional course. 74 (18.9) 83 (21.2) 74 (18.9) 22 (5.6) 55 (14.1) 48 (12.3) 35 (9.0)
I believe that I can make the same grade in an online course as in a traditional course. 41 (10.5) 48 (12.3) 42 (10.7) 39 (10.0) 67 (17.1) 101 (25.8) 53 (13.6)

Relationships between participant characteristics and their preferences for online education 

Age

One survey respondent was omitted from analysis due to an erroneous input of their age (“2t”) which could not be validated. As reported in Table 2, no significant correlation was observed between age and preference for online education. 

Likert-scale Statement What is your current age?
n Pearson Correlation p-value
Most people believe that online learning is more effective than traditional methodologies. 390 0.02 0.66
In a course with both traditional and online methodologies, I learn better through the online format. 390 0.09 0.07
I prefer online courses to traditional courses. 390 0.06 0.23
I believe that I can learn the same amount in an online course as in a traditional course. 390 0.03 0.56
I believe that I can make the same grade in an online course as in a traditional course. 390 0.01 0.79

Gender

Only male and female genders were used in the analysis as these categories made up 99.49{af0afab2a7197b4b77fcd3bf971aba285b2cb7aa14e17a071e3a1bf5ccadd6db} of the sample. As reported in Table 3, no significant relationship existed between gender and preference for online education. 

Statement Gender n Mean Standard Deviation t df Two-sided p-value Mean Difference 95{af0afab2a7197b4b77fcd3bf971aba285b2cb7aa14e17a071e3a1bf5ccadd6db} Confidence Interval of the Difference
Lower Bound Upper Bound  
Most people believe that online learning is more effective than traditional methodologies. Male 72 2.64 1.50 -0.16 387 0.87 -0.03 -0.43   0.37    
Female 317 2.67 1.56  
In a course with both traditional and online methodologies, I learn better through the online format. Male 72 2.72 1.68 -0.31 387 0.76 -0.07 0.23 -0.52  
Female 317 2.79 1.75  
I prefer online courses to traditional courses. Male 72 2.89 1.84 -0.09 387 0.93 -0.02 -0.51 0.47  
Female 317 2.91 1.92  
I believe that I can learn the same amount in an online course as in a traditional course. Male 72 3.58 2.07 0.59 387 0.56 0.15 -0.36 0.66  
Female 317 3.43 1.95  
I believe that I can make the same grade in an online course as in a traditional course. Male 72 4.33 2.06 -0.44 387 0.66 -0.11 -0.61 0.39  
Female 317 4.44 1.93  

History of Taking an Online Course Previously

As reported in Table 4, no significant relationship existed between taking an online course previously and preference for online education. 

Statement Online Course Previously n Mean Standard Deviation t df Two-sided p-value Mean Difference 95{af0afab2a7197b4b77fcd3bf971aba285b2cb7aa14e17a071e3a1bf5ccadd6db} Confidence Interval of the Difference
Lower Bound Upper Bound  
Most people believe that online learning is more effective than traditional methodologies. Yes 376 2.66 1.53 -0.74 14.58 0.47 -0.41 -1.59   0.77  
No 15 3.07 2.12  
In a course with both traditional and online methodologies, I learn better through the online format. Yes 376 2.77 1.71 -0.79 14.56 0.45 -0.50 -1.85 0.86  
No 15 3.27 2.43  
I prefer online courses to traditional courses. Yes 376 2.90 1.88 -0.61 389 0.54 -0.30 -1.29 0.68  
No 15 3.20 2.31  
I believe that I can learn the same amount in an online course as in a traditional course. Yes 376 3.44 1.96 -1.86 389 0.06 -0.96 -1.98 0.06  
No 15 4.40 2.20  
I believe that I can make the same grade in an online course as in a traditional course. Yes 376 4.38 1.94 -2.74 15.53 0.02 -1.22 -2.17 -0.27  
No 15 5.60 1.68  

Preferred Learning Style

As reported in Table 5, the highest mean score (most agreement) for each Likert-scale statement was observed with those who selected reading/writing as their preferred learning style; four out of the five differences in means reached statistical significance. There were also statistically significant findings on the pairwise analysis of the different learning styles (Table 6). 

Likert-scale Statement Visual n Mean Standard Deviation 95{af0afab2a7197b4b77fcd3bf971aba285b2cb7aa14e17a071e3a1bf5ccadd6db} confidence interval for mean p-value
Lower Bound Upper Bound
Most people believe that online learning is more effective than traditional methodologies. Visual 141 2.75 1.49 2.50 3.00 0.04
Auditory 30 2.70 1.70 2.06 3.34
Reading/Writing 61 3.08 1.80 2.62 3.54
Kinesthetic 159 2.44 1.44 2.21 2.67
In a course with both traditional and online methodologies, I learn better through the online format. Visual 141 2.84 1.71 2.56 3.13 0.02
Auditory 30 2.77 1.87 2.07 3.46
Reading/Writing 61 3.33 2.07 2.80 3.86
Kinesthetic 159 2.53 1.56 2.29 2.78
I prefer online courses to traditional courses. Visual 141 3.01 1.83 2.71 3.32 0.01
Auditory 30 2.73 1.91 2.02 3.45
Reading/Writing 61 3.56 2.25 2.98 4.13
Kinesthetic 159 2.60 1.75 2.32 2.87
I believe that I can learn the same amount in an online course as in a traditional course. Visual 141 3.57 1.99 3.24 3.90 0.55
Auditory 30 3.57 1.96 2.83 4.30
Reading/Writing 61 3.66 2.06 3.13 4.18
Kinesthetic 159 3.30 1.94 3.00 3.61
I believe that I can make the same grade in an online course as in a traditional course. Visual 141 4.43 1.97 4.10 4.75 0.04
Auditory 30 4.47 2.13 3.67 5.26
Reading/Writing 61 5.03 1.75 4.58 5.48
Kinesthetic 159 4.19 1.93 3.89 4.49
Likert-scale Statement Preferred Learning Style (a) Preferred Learning Style (b) Mean difference
(a-b)
95{af0afab2a7197b4b77fcd3bf971aba285b2cb7aa14e17a071e3a1bf5ccadd6db} confidence interval for mean p-value
Lower Bound Upper Bound
Most people believe that online learning is more effective than traditional methodologies. Visual Auditory 0.05 -0.75 0.85 1.00
Reading/Writing -0.33 -0.94 0.28 0.50
Kinesthetic 0.31 -0.15 0.77 0.30
Auditory Visual -0.05 -0.85 0.75 1.00
Reading/Writing -0.38 -1.27 0.50 0.68
Kinesthetic 0.26 -0.53 1.05 0.83
Reading/Writing Visual 0.33 -0.28 0.94 0.50
Auditory 0.38 -0.50 1.27 0.68
Kinesthetic 0.64 0.04 1.24 0.03
Kinesthetic Visual -0.31 -0.77 0.15 0.30
Auditory -0.26 -1.05 0.53 0.83
Reading/Writing -0.64 -1.24 -0.04 0.03
In a course with both traditional and online methodologies, I learn better through the online format. Visual Auditory 0.08 -0.82 0.97 1.00
Reading/Writing -0.48 -1.17 0.20 0.26
Kinesthetic 0.31 -0.21 0.82 0.41
Auditory Visual -0.08 -0.97 0.82 1.00
Reading/Writing -0.56 -1.55 0.43 0.46
Kinesthetic 0.23 -0.65 1.12 0.91
Reading/Writing Visual 0.48 -0.20 1.17 0.26
Auditory 0.56 -0.43 1.55 0.46
Kinesthetic 0.79 0.12 1.46 0.01
Kinesthetic Visual -0.31 -0.82 0.21 0.41
Auditory -0.23 -1.12 0.65 0.91
Reading/Writing -0.79 -1.46 -0.12 0.01
I prefer online courses to traditional courses. Visual Auditory 0.28 -0.69 1.25 0.88
Reading/Writing -0.54 -1.28 0.20 0.23
Kinesthetic 0.42 -0.14 0.98 0.22
Auditory Visual -0.28 -1.25 0.69 0.88
Reading/Writing -0.82 -1.90 0.26 0.20
Kinesthetic 0.16 -0.83 1.10 0.98
Reading/Writing Visual 0.54 -0.20 1.28 0.23
Auditory 0.82 -0.26 1.90 0.20
Kinesthetic 0.96 0.23 1.69 0.00
Kinesthetic Visual -0.42 -0.98 0.14 0.22
Auditory -0.14 -1.10 0.83 0.98
Reading/Writing -0.96 -1.69 -0.23 0.00
I believe that I can learn the same amount in an online course as in a traditional course. Visual Auditory 0.00 -1.03 1.03 1.00
Reading/Writing -0.09 -0.87 0.69 0.99
Kinesthetic 0.27 -0.33 0.86 0.65
Auditory Visual -0.00 -1.03 1.03 1.00
Reading/Writing -0.09 -1.23 1.05 1.00
Kinesthetic 0.26 -0.75 1.28 0.91
Reading/Writing Visual 0.09 -0.69 0.87 0.99
Auditory 0.09 -1.05 1.23 1.00
Kinesthetic 0.35 -0.42 1.12 0.64
Kinesthetic Visual -0.27 -0.86 0.33 0.65
Auditory -0.26 -1.28 0.75 0.91
Reading/Writing -0.35 -1.12 0.42 0.64
I believe that I can make the same grade in an online course as in a traditional course. Visual Auditory -0.04 -1.04 0.96 1.00
Reading/Writing -0.61 -1.37 0.16 0.17
Kinesthetic 0.24 -0.34 0.81 0.72
Auditory Visual 0.04 -0.96 1.04 1.00
Reading/Writing -0.57 -1.68 0.55 0.56
Kinesthetic 0.28 -0.72 1.27 0.89
Reading/Writing Visual 0.61 -0.16 1.37 0.17
Auditory 0.57 -0.55 1.68 0.56
Kinesthetic 0.84 0.09 1.60 0.02
 Kinesthetic Visual -0.24 -0.81 0.34 0.72
Auditory -0.28 -1.27 0.72 0.89
Reading/Writing -0.84 -1.60 -0.09 0.02

Discussion

Purpose and major findings

The PA educational community has endured many challenges and evolved significantly over the last few years. Due to the unfortunate COVID-19 global pandemic, almost every PA program across the country quickly discovered its ability to implement didactic curriculum online and continue the education of PA students at a time when clinicians were crucially needed [23]. Academic administrators, faculty, students, and other stakeholders must now decide what role hybrid PA programs have in the future of PA education. Perceptions of PA students toward online learning should be considered in this discussion; determining these perceptions was the purpose of this study. 

Most pre-COVID-19 studies show that health professions students generally prefer in-person over online education [13-17], and the results of the current study align with those findings. However, the current study also reveals a significant number of PA students who do prefer learning in an online environment. Despite the majority of participants (69.31{af0afab2a7197b4b77fcd3bf971aba285b2cb7aa14e17a071e3a1bf5ccadd6db}, n = 271) preferring traditional courses, the survey nevertheless identified 23.79{af0afab2a7197b4b77fcd3bf971aba285b2cb7aa14e17a071e3a1bf5ccadd6db} (n = 93) who preferred online learning. Furthermore, as the sample population did not include students from programs that currently use online programming as a major component of their curriculum [2], the preference for online education of the entire PA student population may be slightly higher than reported here. The current study also provides insight into the type of student who may prefer learning online. Interestingly, data analysis showed no correlation between age and students’ preference for online education. Similarly, there were no significant relationships between gender or having previously taken an online course and preference for online education. However, a statistically significant relationship did exist between self-reported preferred learning styles and preference for online learning. Although only 15.6{af0afab2a7197b4b77fcd3bf971aba285b2cb7aa14e17a071e3a1bf5ccadd6db} (n = 61) of the sample reported their preferred learning style as reading/writing, this group had the most agreement with all Likert-scale statements favoring online education; four out of five of these results were statistically significant. 

Relevance of findings 

A substantial interest among PA students in online didactic education is not surprising considering other recent studies of medical students in a post-COVID-19 educational environment. Stoehr et al. collected cross-sectional data from 3,286 medical students across 12 countries [24]. In their study, 91{af0afab2a7197b4b77fcd3bf971aba285b2cb7aa14e17a071e3a1bf5ccadd6db} of participants agreed that lecture-style education was a suitable teaching concept for online learning, 97{af0afab2a7197b4b77fcd3bf971aba285b2cb7aa14e17a071e3a1bf5ccadd6db} indicated they had the devices required for online learning, 80{af0afab2a7197b4b77fcd3bf971aba285b2cb7aa14e17a071e3a1bf5ccadd6db} felt comfortable using the software required for online learning, 76{af0afab2a7197b4b77fcd3bf971aba285b2cb7aa14e17a071e3a1bf5ccadd6db} felt well prepared for online learning, and 62{af0afab2a7197b4b77fcd3bf971aba285b2cb7aa14e17a071e3a1bf5ccadd6db} reported being happy with the quality of online courses [24]. Another post-COVID-19 study of 64 medical students at a United States-based allopathic medical school that moved the entire pre-clinical curriculum to a virtual format during the pandemic demonstrated that 70.3{af0afab2a7197b4b77fcd3bf971aba285b2cb7aa14e17a071e3a1bf5ccadd6db} of students reported an unchanged or improved overall medical education in a virtual course module compared to a previous module that was taught in a traditional face-to-face setting [25]. Furthermore, a recent systematic review of 24 studies measuring medical student satisfaction with e-learning during the pandemic indicated that 51.8{af0afab2a7197b4b77fcd3bf971aba285b2cb7aa14e17a071e3a1bf5ccadd6db} of the 15,473 medical students studied were satisfied [26]. 

Study limitations

A potential limitation to this study is that it was conducted during the COVID-19 pandemic and perceptions of online education may have been influenced by either positive or negative experiences encountered during this turbulent time in medical education. Furthermore, the study was not experimental in nature and, therefore, could not control for other variables that may have influenced student perception of online PA education, such as the quality of instructional design and the types of resources made available to students at different institutions. Another limitation was that students were asked to self-report their VARK [21] learning style instead of completing the VARK questionnaire, and students were limited in their selection to only a single preferred learning style. Other limitations to this study are those inherent to survey-based research, including an inability to clarify study questions if needed and not allowing respondents to further explain their answers beyond predetermined survey selections. 

Conclusions

Most didactic PA students (69.31{af0afab2a7197b4b77fcd3bf971aba285b2cb7aa14e17a071e3a1bf5ccadd6db}) prefer traditional in-person education over online learning. However, the number of didactic PA students that do prefer online learning (23.79{af0afab2a7197b4b77fcd3bf971aba285b2cb7aa14e17a071e3a1bf5ccadd6db}) is also substantial. If we generalize these findings to the 11,299 maximum enrollment slots available per the last PAEA Program Report, there are potentially 2,689 students who may benefit from online/hybrid PA education. Despite these findings, only three out of the 282 currently accredited PA programs are designed to offer a significant portion of their curriculum in an online/hybrid format. Although more research is needed regarding hybrid PA education, based on the findings of this study, the researchers recommend more institutions consider exploring and/or piloting this type of program delivery. Future studies may consider determining the characteristics and preferred learning styles of students who decide to apply to online/hybrid PA programs and how a student’s preferred learning style relates to their satisfaction with, and success in, an online PA educational environment.